 |
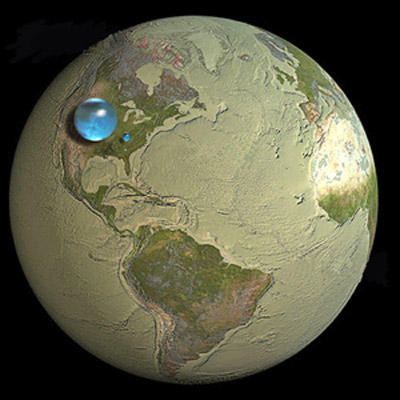
| Fig. 1 USGS: Water on Earth |
The larger one represents ocean water, while the tinier one over Kentucky represents fresh water.
The link under the graphic explains the details.
There are several estimates as to the volume of water in the oceans.
Historically the ocean has been a thing of myth and superstition (falling off the edge, etc.), but even in modern times the estimates have gone from about 1.3 x 10⁹ km3 to about 1.5 x 10⁹ km3 (Physics Factbook).
More recently, scientists at Woods Hole have said:
"A lot of water values are taken for granted," said Matthew Charette, an associate scientist at the Woods Hole Oceanographic Institution (WHOI) in Woods Hole, Mass., who led the new audit of the oceans. "If you want to know the water volume on the planet, you Google it and you get five different(Live Science, emphasis added). Their (Woods Hole) values of 1.332 x 10⁹ km3 (ocean volume) and 3682.2 m (avg. ocean depth) are the more accurate at this time, so I am using them until further notice (replacing the 1.37 x 10⁹ km3 I have been using).
numbers, most of them 30- or 40-year-old values."
Fig. 2 Thermal Expansion NE U.S. coast
...
Satellite measurements do have their shortcomings though: "There is a problem of spatial resolution, like an out-of-focus camera," Smith explained. "We're measuring the sea surface that is affected by mountains, but we're seeing only really big mountains, and in a blurry way. The resolution is 15 times worse than our maps of Mars and the moon."

Regular readers know that in the past I have consistently projected graphs that featured thermal expansion at ~5.1% of sea level change:
At any rate, thermal expansion / contraction is a minor factor in sea level change (~5.1%).(On Thermal Expansion & Thermal Contraction, July 2015, emphasis added). Today, I want to point out some miscalculations I made in a couple of recent graphs concerning thermal expansion calculations (e.g. see here, here, and here).
The major factors of sea level change are ice sheet and glacial melt-water, ice sheet and glacial calving of ice into the oceans, and of course ghost water: The Ghost-Water Constant, 2, 3, 4, 5, 6, 7.
 |
| Fig. 3 TEOS-10 Variables |
Even using actual measurements from WOD, I did not have it down as shown here.
Not only that, two of my SQL database tables had become damaged.
The good news is that I have fixed the database tables, and also I have a better handle on the TEOS-10 toolbox now (Fig. 2 and Fig. 3).
The graph at Fig. 2 shows improved calculations of thermal expansion volume change and ocean volume change using in situ WOD measurements with the TEOS-10 toolbox.
 |
| Fig. 4 Using all WOD zones containing data |
The story begins in 1969 where I use the Woods Hole figure for ocean volume as 1,332,000,000 cubic kilometers (1.332 x 10⁹ km3).
The story ends in 2016 with a new ocean volume of 1,334,470,000 cubic kilometers (1.33447 x 10⁹ km3), an increase of 2,470,000 cubic kilometers (2.47 x 10⁶ km3) which percentage wise is:
Using 4 zones (Fig. 2):And using 487 zones containing 232,378 measurements (Fig. 4):
2,470,000 / 1,332,000,000 = 0.001854354 (.1854%) orig vol 1969
2,470,000 / 1,334,470,000 = 0.001850922 (.1851%) new vol 2016
2,517,940 / 1,334,520,000 = 0.001886776 (~0.19%) new vol 2017So, the Dredd Blog ~5.1% (about 5.1%) is "generous" one might say, however, that percent also contains allowances for land subsidence (dropping in height above sea level) due to pumping groundwater, and land uplift (due to ice-age rebound).
2,517,940 / 1,332,000,000 = 0.001890345 (~0.19%) orig vol 1956
"Give 'em space" is what I say to the "thermal expansion is the major cause of sea level rise in the 19th and 20th centuries" crowd.
Hey readers, "if you see something say something" is our new mantra.
Now, I have to fix the "let's do it back to 1880" module.
Stay tuned.