Using Permanent Service for Mean Sea Level (PSMSL) tide gauge record data makes the task of synchronizing decades and centuries of tide gauge records with newbie satellite data (only collected since 1993) much easier.
That PSMSL data is already synchronized by the "REVISED LOCAL REFERENCE" technique which aligns values to a common reference (RLR).
Thus, one only has to synchronize the Gloabal Mean Satellite Data (GMSD) to the already synchronized PSMSL RLR data gathered from tide gauge stations around the world (Fig. 1).
Fig. 2
Both can then be included in sea level change data in computer generated CSV files, then easily converted into graphs.
Fig. 3
Such as in Fig. 2 where the contrast shows that the "Golden 23" Zones had more sea level rise than the global mean average.
Fig. 4
In Fig. 3 and Fig. 4 the graphs show that the satellite record is less comprehensive, having only been active since 1993.
The main thing to remember is that the tide gauge station records and the satellite records are designed for different purposes.
The satellite record is designed to show a global mean average, a generally fictitious notion, which does little to help local port jurisdictions design their particular song and dance with which they hope to cope with the incessantly rising seas.
The satellite record does next to nothing to tell them how much they individually will have to do to react to the amount of sea level change in their part of the world.
Billions are spent on the satellite records, but very little by comparison is spent on the tide gauge station systems.
Modern technology is fine and dandy, however, in the context of sea level history and future in particular locations, it is not as good as the tide gauge station system IMO.
The HUAC virus has escaped from the dusty minds of those who have been ravaged by its toxoplasma gondii type of symptoms again (The Germ Theory of Government, 2, 3, 4, 5, 6, 7, 8, 9).
In the first post of this series I pointed out a hypothesis about a dynamic which I called "the cultural amygdala", then considered the physical amygdala, and also asked readers about their reactions:
Does fear bubble up inside of you, emanating from your subconscious
amygdala, to automate a reaction when you see photo of the President of Russia?
Or does it prevent you from reading an op-ed in the New York Times which he penned?
If so, that is your cultural amygdala, an extension of your physical amydala which develops as your "birth amygdala" before it has been "customized" by your society, the culture around you (The Cultural Amygdala).
We are studied all the time so those who govern us can get their way:
If you have a patient in a doctor's office who's just been told they have terminal cancer but there's this operation they could perform right now that might save their lives. ... They have a 90 percent chance of surviving the operation — if you tell them that, they respond one way. If you tell them ... that they have a 10 percent chance of being killed by the operation, they are about three times less likely to have the operation.
If you frame something as a loss — 10 percent chance of dying — as opposed to as a gain — 90 percent chance of living — people respond entirely differently. They make a different decision.
(Are You Of Two Minds?). The studies go deeper, and sometimes have a commercial purpose:
A group of US marketing researchers claim that brand owners can make their customers believe they had a better experience of a product or service than they really did by bombarding them with positive messages after the event. Advocates of the technique, known as "memory morphing", claim it can be used to improve customers' perceptions of products and encourage them to repeat their purchases and recommend brands to friends.
"When asked, many consumers insist that they rely primarily on their own first-hand experience with products – not advertising – in making purchasing decisions. Yet, clearly, advertising can strongly alter whatconsumers remember about their past, and thus influence their behaviours," he writes in his book, How Customers Think. He says that memories are malleable, changing every time they come to mind, and that brands can use this to their advantage. "What consumers recall about prior product or shopping experiences will differ from their actual experiences if marketers refer to those past experiences in positive ways," he continues.
Now to the point, the nitty gritty of today's post:
We are besieged, readers. As the archives of this magazine make perfectly plain, the spasm of Russophobia now threatening to overcome us is but a variant of the anti-Soviet paranoia that defined the 1950s and early 1960s. “We’re in the most dangerous confrontation with Russia since the Cuban missile crisis,” Stephen Cohen, the noted Russianist (and Nation contributor), said on Amy Goodman’s Democracy Now! earlier this month. This is just the point—the reality we must now consider with utmost seriousness. ... The corporate press, from the government-supervised New York Times on over, now hastens to obscure the same shameful collaboration with power that it displayed in the Cold War’s depths. On a shocking website called PropOrNot.com, Salem witch-hunters who refuse to identify themselves list hundreds of media that they assert are manipulated by the Kremlin. Read these, too, as danger signs. Anyone too young to remember the House Un-American Activities Committee and Red Channels and all the destruction they wrought ought to study up: We are a few short steps away from both. Russia is not destroying (what remains of) American democracy. “Patriotic Americans” are. It is essential, as I suggest, to understand our moment in historical context. Then each of us must decide, just as those called before the HUAC had to: Do I acquiesce or participate in this freakish exercise in crowd control and fear-mongering, or do I repudiate a propaganda campaign as irrational and morally wrong as any concocted during the McCarthy years? At last the question confronts us, and it is especially acute this time for those self-described as progressives: Is one a descendant of that muddled, gutless lot known as Cold War liberals, or does one insist on clear sight and principle even in the face of the ideological blasts our corporate media deliver daily? Think it through: This is the imperative of our moment—a significant moment, because the American propaganda machine is now unusually challenged. Its efficacy is no longer the certainty it was during the Cold War decades. My own view, to be clear straightaway, is without ambivalence. It is our minds that are the objects of this onslaught: They are finally what is at issue. Surrender yours to this most flagrant case of scapegoating—hatred and anxiety conjured from thin air—and your place in the history books will be with the ghosts of all the shrill Cold Warriors and cowering chumps of decades past.
(The Perils of Russophobia, emphasis added). Free thinkers of every nation on Earth unite, because in that context there is nothing better than knowing the natural history of government:
“Experience has shown that even under the best forms of government those entrusted with power have, in time, and by slow operations, perverted it into tyranny.” – Thomas Jefferson
Comprehensive results covering several topics show up when one takes a look at "The NEGIS" (North East Greenland Ice Stream).
We hear the terms "ice sheet" and "ice shelf" often, but rarely do we hear the term "ice stream."
NEGIS is one such "ice river" which travels some 700 km. from the central Greenland Ice Sheet (GIS) highlands, northeast to then empty into the Fram Strait.
It contains about 16% of Greenland's Ice (Fig. 2).
I have written previously that we should keep an eye on the ice shelves, because they are the only impediment to acceleration of ice sheet and ice stream flow into the oceans (Watch The Ice Shelves, 2, 3, 4).
The one ice stream we are talking about is a significant factor in the invasion:
"Understanding the impacts of climate change on ice sheets and the subsequent changes to global sea-level over 100 – 1000yr timescales are fundamental scientific and societal challenges. This project will focus on ... NEGIS ...; a key sector of the Greenland ice sheet (GrIS) because it controls ice flux into the NE Atlantic (an area sensitive to freshwater input) and it holds a sea-level equivalent (SLE) of ~1.4m [4.6 ft.]."
(Greenland @ Warmer Climate, emphasis added; cf. AGU on NEGIS). Add to that the fact that the Arctic's largest ice shelf is now the resident resistance to the NEGIS:
"The largest Greenland and Arctic ice shelf is now at the front of the North East Greenland Ice Stream."
(Jason Box). Not to mention that it is breaking up even as we speak, because of among other things, the warming of the Arctic (ibid).
We hear a lot from Paleoclimatology about ancient sea level (see Fig. 1 sea level marks in rock deposits), but we really do not need to know that to know what is coming (the attendees of the Moody Blues concert are focused on the world as it is now).
So, the existing sea level change of "~1.4m[4.6 ft.]" which is moving toward the ocean around Greenland is of utmost importance, especially since a fellow soldier in that invasion is doing the same thing in Antarctica (Don't Believe In Abrupt Sea Level Change - Know About It - 3).
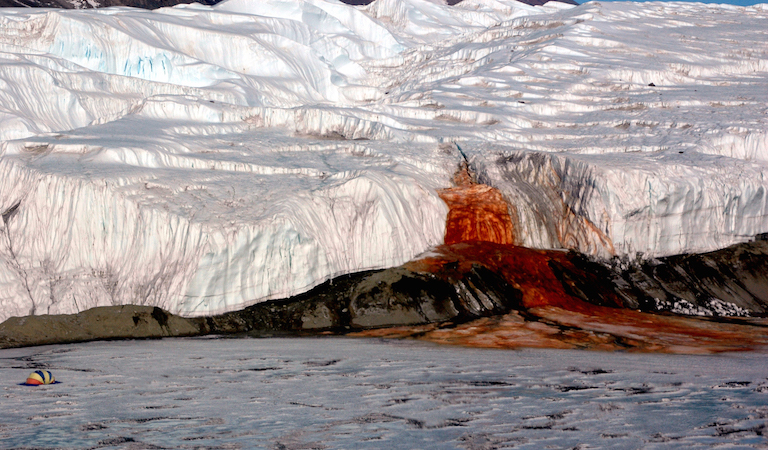
The Red Rock ancient sea level lines (Fig. 1) of the past hovers over our paleounderstanding of what was.
But our understanding of the future is incomplete unless we factor in ice sheets, ice streams, and ice shelves.
The government is ignoring the invasion by approving export of fossil fuels from a port area that is increasingly an endangered species because of sea level rise in the Gulf of Mexico (Fig. 3, Fig. 4).
In this series I have discussed the slow-moving coup in the remaining branch of government, the Judiciary.
The coup of the judiciary has been taking place for a decade or so.
We saw "the alt-right" take off their clothes to become quite "naked" (obvious) in the unprecedented Republican obstructionism events around the Obama appointment of the leading judge from the Federal Appellate Court for the District of Columbia to the U.S. Supreme Court (Judge Merrick Garland).
I mention the alt-right becoming obvious (or naked), because the coup (like the gerrymandering coup, the taking over of state legislatures, and governorships coups) have until now all been underground, well planned out, and executed surreptitiously.
As I wrote in a previous post:
"Here's the core constitutional fact: a progressive president and Congress now face a conservative judiciary, for the first time since 1937. Obama's ambitious agenda, if enacted, must go before federal courts—where judges can rewrite or strike down key provisions."
(Here Come De Conservative Judges, 2009 quoting Newsweek, emphasis added). In other words, not much was said of it back then because the "clothing" was still on.
That will change beginning in January of 2017, 80 years after the judiciary became more liberal in 1937 (the New Deal era).
To begin with, a critical Supreme Court Justice, and about a hundred federal judges need to be appointed (CBS News, WaPo, Newser).
That is twice what Obama started out with.
As I said in another series that looked at this ongoing judiciary coup:
This case is brought at a time when the scenario described by Col. Wilkerson (even before he knew of the election results) is "extremely dangerous" (see first video below !).
Add to that the intention of the Republican Party to load the Supreme Court with climate change deniers, and it adds up to an increased likelihood of a constitutional crisis in our near future.
Unless the W Direction is changed, The American Children will eventually lose this case in the alt-right supreme court, and who knows what else.
Substantial discoveries in Antarctica which will impact the U.S. East Coast are currently becoming more of a part of reality.
As regular readers know, from time to time Dredd Blog has uncovered this under-the-cover ice sheet reality which, as usual, is a reality that is considered by the timid to be more like science fiction than the science fact that it really, really is:
"UCL Professor Duncan Wingham, who led the team, said: "Previously, it was thought water moves underneath the ice by very slow seepage. But this new data shows that, every so often, the lakes beneath the ice pop off like champagne corks, releasing floods that travel very long distances."
"... the new picture—gradually revealed by space and airborne instruments, ground-based GPS and increasingly sophisticated computer models—is one of intricate and dynamic hydrology. Rapidly flowing subglacial streams channel water from one hidden lake to another, sudden drainage causes massive collapse, and the meltwater speeds the slide of mighty glaciers toward the sea. The big picture was put together by a group of researchers specializing in oceans and ice and published in The Royal Society of London’s “Philosophical Transactions A” in August 2016. It shows significant progress in the understanding of Antarctica’s under-ice lake systems ... “Ten years ago, we didn’t realize subglacial lakes were so active,” said Helen Fricker of the Scripps Institution of Oceanography, a member of NASA’s Sea Level Change Team and lead author of the research group’s review article. “We didn’t realize water moves so quickly from one lake to another. We didn’t know it was a dynamic system, where water could transfer so quickly ... Previous studies using other techniques estimated the average melting rates at the bottom of Dotson and Crosson ice shelves to be about 40 feet per year (12 meters per year). Khazendar and his team, using their direct radar measurements, found stunning rates of ice loss from the glaciers' undersides on the ocean sides of their grounding lines. The fastest-melting glacier, Smith, lost between 984 and 1,607 feet (300 and 490 meters) in thickness from 2002 to 2009 near its grounding line, or up to 230 feet per year (70 meters per year) ...
"If I had been using data from only one instrument, I wouldn't have believed what I was looking at, because the thinning was so large," Khazendar added. However, the two IceBridge instruments, which use different observational techniques, both measured the same rapid ice loss.”
(Beneath Antarctic ice: lakes, floods and flowing water, 2016, emphasis added). Yes, startling surprises caused by these phenomena are characterized as "850 year events" when they finally reach "the homeland" these days:
Our analysis of multi-decadal tide gauge records along the North American east coast identified an extreme sea-level rise event during 2009–2010. Within this relatively brief two-year period, coastal sea level north of New York City jumped by up to 128 mm.This magnitude of inter-annual sea level rise is unprecedented in the tide gauge records, with statistical methods suggesting that it was a 1-in-850 year event.
For decades they have been thinking in terms of the "it will never melt because it is so stable" myth:
"I suspect the existence of what I call the `John Mercer effect'. Mercer (1978) suggested that global warming from burning of fossil fuels could lead to disastrous disintegration of the West Antarctic ice sheet, with a sea level rise of several meters worldwide. This was during the era when global warming was beginning to get attention from the United States Department of Energy and other science agencies. I noticed that scientists who disputed Mercer, suggesting that his paper was alarmist, were treated as being more authoritative. ... I believe there is a pressure on scientists to be conservative. Papers are accepted for publication more readily if they do not push too far and are larded with caveats. Caveats are essential to science, being born in skepticism, which is essential to the process of investigation and verification. But there is a question of degree. A tendency for `gradualism' as new evidence comes to light may be ill-suited for communication, when an issue with a short time fuse is concerned."
Think of the Agnotology generators as educational system neutralizers, invoked to cover the trail of murderous Oil-Qaeda (Humble Oil-Qaeda).
If the denier cabal, which is currently drooling over their newfound governmental powers, gets its way the science textbooks will become Voynich manuscripts (Ancient Ecocosmology?).
The next post in this series is here, the previous post in this series is here.
Fig. 1
(Most active quake zones: Japan, Black Sea)
Based on about 50,000 earthquake records in my SQL database, two areas stand out, in terms of number of earthquakes (outlined in red in Fig. 1) where faults exist.
The area around Japan (between latitude 30-50N, longitude 130-150E) is the top quake-count area with 16,547 quakes having taken place in that area between 1772 and 2013.
Fig. 2 Quakes per year
The annual distribution of those quakes over the years is shown in Fig. 2.
The totals for the three individual WOD zones in the Japan area are: Zone 1313 had 11,081 quakes; Zone 1314 had 2,435 quakes; and Zone 1414 had 3,031 quakes.
Fig. 3
The area with the second-most number of quakes is located near the Black Sea (between latitude 30-50N, longitude 40-50E).
Fig. 4 Black Sea area sea level change
Total quake-count for the two zones was 4,904 quakes having taken place in that area between 1785 and 2012.
Of that, Zone 1304 had 2,537 quakes and Zone 1404 had 2,367 quakes.
The yearly distribution of those quakes in those zones is shown in Fig. 3.
Fig. 5 Japan area sea level change
I discussed the Black Sea area in a previous post or two.
Additionally, the context in those posts did not include earthquakes as the current series on "pressures put on the Earth's crust" does.
Those posts also focused in on a more narrow geographical area than the current post does.
Fig. 7 Ocean Temperatures
A very high sea level rise has taken place in that smaller area, about a half a foot higher than the area we are focusing on today.
Thus, the sea level rise graph at Fig. 4 does not show as intense of an amount of sea level rise as the more narrow focus did (about 4.1 ft. compared to about 3.6 ft.).
Even more strange in a sense, the sea level rise in the Japan area, where the most quakes took place, experienced even less sea level rise (Fig. 5).
This observation does show that there is no direct relation between the number of earthquakes and the amount of sea level rise in a given geographical area.
But it does show that as sea level changes increase over time, it can impact the number of quakes even if not in a mathematically exact way.
As it turns out, we can say that sea level rise and fall can change the degree of pressure being put on the Earth's crust, and further, that those changing pressures can trigger quakes in hair-trigger areas.
The same can be said for quakes taking place away from oceans and coastlines:
The number of earthquakes has increased dramatically over the past few years within the central and eastern United States. Nearly 450 earthquakes magnitude 3.0 and larger occurred in the four years from 2010-2013, over 100 per year on average, compared with an average rate of 20 earthquakes per year observed from 1970-2000.
This increase in earthquakes prompts two important questions: Are they natural, or man-made? And what should be done in the future as we address the causes and consequences of these events to reduce associated risks? USGS scientists have been analyzing the changes in the rate of earthquakes as well as the likely causes, and they have some answers.
USGS scientists have found that at some locations the increase in seismicity coincides with the injection of wastewater in deep disposal wells. Much of this wastewater is a byproduct of oil and gas production and is routinely disposed of by injection into wells specifically designed for this purpose.
...
Although it may seem like science fiction, man-made earthquakes have been a reality for decades. It has long been understood that earthquakes can be induced by impoundment of water in reservoirs, surface and underground mining, withdrawal of fluids and gas from the subsurface, and injection of fluids into underground formations.
(USGS, "Man-Made Earthquakes Update"; cf. this). Some forms of changing the volume and mass of water in an area is known, but not well understood:
The column of water in a large and deep artificial lake alters in-situ stress along an existing fault or fracture. In these reservoirs, the weight of the water column can significantly change the stress on an underlying fault or fracture by increasing the total stress through direct loading, or decreasing the effective stress through the increased pore water pressure. This significant change in stress can lead to sudden movement along the fault or fracture, resulting in an earthquake. Reservoir-induced seismic events can be relatively large compared to other forms of induced seismicity. Though understanding of reservoir-induced seismic activity is very limited, it has been noted that seismicity appears to occur on dams with heights larger than 330 feet (100 m). The extra water pressure created by large reservoirs is the most accepted explanation for the seismic activity. When the reservoirs are filled or drained, induced seismicity can occur immediately or with a small time lag.
(Wikipedia, "Seismicity"). The key is whether or not an earthquake fault line is being affected, which is more likely in the far-and-wide reaching reality of all of the world's oceans being changed in terms of depth, mass, and volume (1 m3 of water weighs 2,204.623 lbs. --about 1 compact car).
But seismic science is not fine-tuned enough to say exactly where quakes will take place as a result of sea level change.
No, it is at this time only a general observation about general eventualities, which are clear (see graphs in this series).
In the future this might improve to become as accurate as one scientist who predicted a specific volcano would erupt as the ice melted in the cryosphere of Iceland (Is A New Age Of Pressure Upon Us? - 4).
In closing, I added the water temperature records from the World Ocean Database (WOD) as shown in Fig. 6 and Fig. 7.
Those two graphs are added just to reiterate that ocean water temperature is not a major factor in sea level change, as has been discussed at length on Dredd Blog (On Thermal Expansion & Thermal Contraction, 2, 3, 4, 5, 6, 7, 8, 9).
The next post in this series is here, the previous post in this series is here.
Steppin' In A Slide Zone ...